At least 1.7 million species of living organisms have been discovered, and the list grows longer every year (especially of insects in the tropical rain forest). How are they to be classified?
Ideally, classification should be based on homology; that is, shared characteristics that have been inherited from a common ancestor. The more recently two species have shared a common ancestor,
- the more homologies they share, and
- the more similar these homologies are.
Until recent decades, the study of homologies was limited to
However, since the birth of molecular biology, homologies can now also be studied at the level of
The figure shows the bones in the forelimbs of three mammals: human, whale, and bat (obviously not drawn to the same scale!). Although used for such different functions as throwing, swimming, and flying, the same basic structural plan is evident in them all. In each case, the bone shown in color is the radius.
Body parts are considered homologous if they have
- the same basic structure
- the same relationship to other body parts, and, as it turns out,
- develop in a similar manner in the embryo.
It seems unlikely that a single pattern of bones represents the best possible structure to accomplish the functions to which these forelimbs are put. However, if we interpret the persistence of the basic pattern as evidence of inheritance from a common ancestor, we see that the various modifications are adaptations of the plan to the special needs of the organism. It tells us that evolution is opportunistic, working with materials that have been handed down by inheritance.
Protein sequencing provides a tool for establishing homologies from which genealogies can be constructed and phylogenetic trees drawn.
Here are two examples.
| Human beta chain |
0 |
| Gorilla |
1 |
| Gibbon |
2 |
| Rhesus monkey |
8 |
| Dog |
15 |
| Horse, cow |
25 |
| Mouse |
27 |
| Gray kangaroo |
38 |
| Chicken |
45 |
| Frog |
67 |
| Lamprey |
125 |
| Sea slug (a mollusk) |
127 |
| Soybean (leghemoglobin) |
124 |
An example of molecular homology.
The numbers represent the number of amino acid differences between the beta chain of human hemoglobin and the hemoglobins of the other species. In general, the number is inversely proportional to the closeness of kinship.
All the values listed are for the beta chain except for the last three, in which the distinction between alpha and beta chains does not occur.
The human beta chain contains 146 amino acid residues, as do most of the others.
Cytochrome c is part of the electron transport chain down which electrons are passed to oxygen during cellular respiration. [Discussion]
Cytochrome c is found in the mitochondria of every aerobic eukaryote — animal, plant, and protist. The amino acid sequences of many of these have been determined, and comparing them shows that they are related.
Human cytochrome c contains 104 amino acids, and 37 of these have been found at equivalent positions in every cytochrome c that has been sequenced. We assume that each of these molecules has descended from a precursor cytochrome in a primitive microbe that existed over 2 billion years ago. In other words, these molecules are homologous.
The first step in comparing cytochrome c sequences is to align them to find the maximum number of positions that have the same amino acid. Sometimes gaps are introduced to maximize the number of identities in the alignment (none was needed in this table). Gaps correct for insertions and deletions that occurred during the evolution of the molecule.
This table shows the N-terminal 22 amino acid residues of human cytochrome c with the corresponding sequences from six other organisms aligned beneath. A dash indicates that the amino acid is the same one found at that position in the human molecule. All the vertebrate cytochromes (the first four) start with glycine (Gly). The Drosophila, wheat, and yeast cytochromes have several amino acids that precede the sequence shown here (indicated by <<<). In every case, the heme group of the cytochrome is attached to Cys-14. and Cys-17 (human numbering). In addition to the two Cys residues, Gly-1, Gly-6, Phe-10, and His-18 are found at the equivalent positions in every cytochrome c that has been sequenced.
Molecular homology of cytochrome c (see three-letter code of amino acids)
| |
|
1 |
|
|
|
|
6 |
|
|
|
10 |
|
|
|
14 |
|
|
17 |
18 |
|
20 |
|
|
| Human |
|
Gly |
Asp |
Val |
Glu |
Lys |
Gly |
Lys |
Lys |
Ile |
Phe |
Ile |
Met |
Lys |
Cys |
Ser |
Gln |
Cys |
His |
Thr |
Val |
Glu |
Lys |
| Pig |
|
- |
- |
- |
- |
- |
- |
- |
- |
- |
- |
Val |
Gln |
- |
- |
Ala |
- |
- |
- |
- |
- |
- |
- |
| Chicken |
|
- |
- |
Ile |
- |
- |
- |
- |
- |
- |
- |
Val |
Gln |
- |
- |
- |
- |
- |
- |
- |
- |
- |
- |
| Dogfish |
|
- |
- |
- |
- |
- |
- |
- |
- |
Val |
- |
Val |
Gln |
- |
- |
Ala |
- |
- |
- |
- |
- |
- |
Asn |
| Drosophila |
<<< |
- |
- |
- |
- |
- |
- |
- |
- |
Leu |
|
Val |
Gln |
Arg |
|
Ala |
- |
- |
- |
- |
- |
- |
Ala |
| Wheat |
<<< |
- |
Asn |
Pro |
Asp |
Ala |
- |
Ala |
- |
- |
- |
Lys |
Thr |
- |
- |
Ala |
- |
- |
- |
- |
- |
Asp |
Ala |
| Yeast |
<<< |
- |
Ser |
Ala |
Lys |
- |
- |
Ala |
Thr |
Leu |
- |
Lys |
Thr |
Arg |
- |
Glu |
Leu |
- |
- |
- |
- |
- |
- |
We assume that the more identities there are between two molecules, the more recently they have evolved from a common ancestral molecule and thus the closer the kinship of their owners. Thus the cytochrome c of the rhesus monkey is identical to that of humans except for one amino acid, whereas yeast cytochrome c differs from that of humans at 44 positions. (There are no differences between the cytochrome c of humans and that of chimpanzees.)
 With such information, one can reconstruct an evolutionary history of the molecule and thus of their respective owners. This requires
- using the genetic code to determine the minimum number of nucleotide substitutions in the DNA of the gene needed to derive one protein from another and
- a powerful computer program to search for the shortest paths linking the molecules together.
The result is a phylogenetic tree. This one (the work of Walter M. Fitch and Emanuel Margoliash) shows the relationship between 20 species of eukaryotes. The numbers represent the minimum number of nucleotide substitutions in the gene for cytochrome c needed to produce these 20 proteins from a series of hypothetical ancestral genes at the various branching points (nodes).
The tree corresponds quite well to what we have long believed to be the evolutionary relationships among the vertebrates. But there are some anomalies. It indicates, for example, that the primates (humans and monkeys) split off before the split separating the kangaroo, a marsupial, from the other placental mammals. This is certainly wrong. But sequence analysis of other proteins can resolve such discrepancies.
Cytochrome c is an ancient molecule, and it has evolved very slowly. Even after more than 2 billion years, one-third of its amino acids are unchanged. This conservatism is a great help in working out the evolutionary relationships between distantly-related creatures like fish and humans.
But what of humans and the great apes? Their cytochrome c molecules are identical and can tell us nothing about evolutionary relationships.
However, some proteins have evolved much more rapidly than cytochrome c, and these can be used to decipher recent evolutionary events. During blood clotting, short peptides are cut from fibrinogen converting it into insoluble fibrin. Once removed, these fibrinopeptides have no further function. They have been pretty much free from the rigors of natural selection and have, consequently, diverged rapidly during evolution. So they provide data useful in sorting out the twigs of phylogenetic trees of mammals, for example.
As we saw in the comparison of human and kangaroo cytochrome c, a single molecule provides only a narrow window for glimpsing evolutionary relationships.
The technique of DNA-DNA hybridization provides a way of comparing the total genome of two species. Let us examine the procedure as it might be used to assess the evolutionary relationship of species B to species A:
- The total DNA is extracted from the cells of each species and purified.
- For each, the DNA is heated so that it becomes denatured into single strands (ssDNA).
- The temperature is lowered just enough to allow the multiple short sequences of repetitive DNA to rehybridize back into double-stranded DNA (dsDNA).
- The mixture of ssDNA (representing single genes) and dsDNA (representing repetitive DNA) is passed over a column packed with hydroxyapatite. The dsDNA sticks to the hydroxyapatite; ssDNA does not and flows right through. The purpose of this step is to be able to compare the information-encoding portions of the genome — mostly genes present in a single copy — without having to worry about varying amounts of noninformative repetitive DNA.
- The ssDNA of species A is made radioactive.
- The radioactive ssDNA is then allowed to rehybridize with nonradioactive ssDNA of the same species (A) as well as — in a separate tube — the ssDNA of species B.
- After hybridization is complete, the mixtures (A/A) and (A/B) are individually heated in small (2°–3°C) increments. At each higher temperature, an aliquot is passed over hydroxyapatite. Any radioactive strands (A) that have separated from the DNA duplexes pass through the column, and the amount is measured from their radioactivity.
- A graph showing the percentage of ssDNA at each temperature is drawn.
- The temperature at which 50% of the DNA duplexes (dsDNA) have been denatured (T50H) is determined.
As the figure shows, the curve for A/B is to the left of A/A, i.e., duplexes of A/B separated at a lower temperature than those of A/A. The sequences of A/A are precisely complementary so all the hydrogen bonds between complementary base pairs (A-T, C-G) must be broken in order to separate the strands. But where the gene sequences in B differ from those in A, no base pairing will have occurred and denaturation is easier.
Thus DNA-DNA hybridization provides genetic comparisons integrated over the entire genome. Its use has cleared up several puzzling taxonomic relationships.
DNA-DNA hybridization can also be used to compare genomes of mixed populations of organisms. For example,
- when all the bacteria are extracted from 10 g of uncontaminated soil (there are about 1010 cells in it!);
- the DNA extracted and purified from the bacteria and
- subjected to DNA-DNA hybridization analysis,
the resulting curves indicate that there are over a million different species in the soil sample, although the population is dominated by only a few of these.
Another way to compare entire genomes is to
- attach a fluorescent label to the DNA of individual chromosomes of one species (e.g., human) and
- expose the chromosomes of another species to it.
- Regions of gene homology will hybridize taking up the fluorescent label and the "painted" chromosomes can be examined under the microscope.
The method is a modification of fluorescence in situ hybridization (FISH) and is also called Zoo-FISH.
Chromosome painting has shown, for example, that large sections of human chromosome 6 (which includes hundreds of genes in the major histocompatibility complex (MHC) have their counterpart; i.e. homologous genes, in
- chromosome 5 of the chimpanzee
- chromosome B2 of the domestic cat
- chromosome 7 of the pig
- chromosome 23 of the cow
- etc.
Proteins are the expression of genes so why not compare the actual gene sequences? There are several advantages:
- DNA is much easier to sequence than protein. [Link to DNA sequencing.]
- Genes contain sites that are much freer to change during evolution than protein sequences are. These include:
- nucleotides that produce synonymous codons. For example, even if the amino acid at position 20 in two proteins is the same, the codons for that amino acid might be different in the two species.
- Introns and flanking sequences. These regions are relatively free to vary without hurting the final protein product. In other words, these regions of the genome are under much less pressure from natural selection.
- DNA is more stable than protein in the environment. This raises the possibility of doing DNA sequencing on the remains of extinct organisms. Neaderthal remains over 38,000 years old have yielded samples of DNA that were successfully sequenced.
Some of the most informative studies using comparative DNA sequencing have been done with
In both cases, the genes are present in multiple copies making their isolation easier.
Ideally, a system of classification should reflect the genealogies of the organisms. Darwin realized this when he wrote: "our classifications will come, as far as they can be so made, genealogies".
A classification based strictly on the rule that all members of a group must have shared a common ancestor more recently than they have with any species outside the group is called cladistics.
This phylogenetic tree or cladogram depicts the evolutionary relationships of 4 hypothetical species.
- They are all descended from an ancestor with 5 traits (1,2,3,4,5) to be used in drawing the tree.
- Over the course of time, 3 speciation events occurred producing the branches.
- During this time, several of the ancestral traits evolved into a modified or derived form; each one indicated by a different color.
Taxonomists who use cladistic methods have created an extraordinary vocabulary to help them (not necessarily us).
- Ancestral traits are called plesiomorphic (shown here as black numbers).
- Derived traits are called apomorphic (shown here as colored numbers). All the members of a clade must share one or more apomorphic traits not found in any other species.
- Derived traits shared by two or more species are called synapomorphic. Here species A and B share the synapomorphic trait designated with a blue 3
.
- Ancestral traits shared by two or more species are called symplesiomorphic. Here, the trait shown as black 1 is a symplesiomorphic trait retained by all 4 species.
|
- Note that in comparing the species, the more recent the common ancestor, the more apomorphic traits they share. Thus species C and D share 4 of the 5 traits but only three (1, 2, and 5) with species A and only two (1 and 5) with species B.
Even if we reconstruct a precise genealogy and draw a phylogenetic tree to represent it, taxonomic problems may still remain.
- The species is the only taxonomic category that exists in nature. All higher categories (e.g., genus, family, and order) are purely arbitrary. They are created by taxonomists.
For example,
- Should species C and D be placed in a single genus with A and B in another?
- Or are all four sufficiently closely related that they belong in a single genus?
- Or are all four so distantly related that they should be placed in separate genera?
- Note that none of these options (and others besides) violates the fundamental rule that all the members of any one group (or "clade") must have had a common ancestor more recent than any they share with species in other groups.

| Those taxonomists who are particularly impressed by the differences between species tend to increase the number of higher categories. Those with this bias are known fondly as "splitters". "Lumpers", those taxonomists who marvel at the uniformities they see among species, tend to create fewer higher categories. Thus, splitters might put each of the 4 species in separate genera while lumpers would put them in a single genus. |
- Classifications based strictly on cladistics are too complex for convenience. In principle, a separate category has to be created for all the branches derived from each node of the tree. The box shows the conventional classification of Homo sapiens (in the order Primates of the class Mammalia). Compare it with the graphic above the box showing a classification of just the primates based more closely on cladistics.
Scientific names. The Swedish naturalist Carolus Linnaeus — the "father of taxonomy" — created the system for naming species that is used by biologists throughout the world. The scientific name of each species consists of two parts:
- the name of the genus to which it is assigned and
- the "specific epithet" which identifies the particular species within the genus.
Latin names were used by Linnaeus, but so many species have been discovered since then that now taxonomists simply coin new words and cast the genus name in the form of a Latin noun and the specific epithet as a Latin adjective. By tradition, both names are printed in italics, and the genus name is capitalized, but not the specific epithet. Note, too, that the characters of the Roman alphabet are always used even by biologists in countries where different characters are used for ordinary purposes. |
Here is a description of a common jellyfish as it appears in a Japanese guide to marine life.
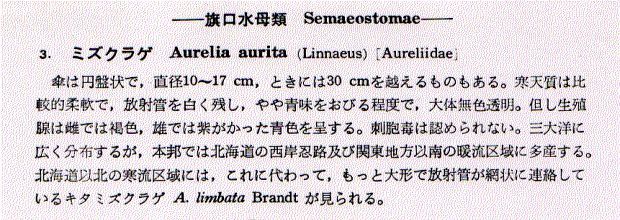 (Reprinted with permission from Hoikusha Publishing Co., Ltd., Tokyo, Japan.)
 |
- A classification based strictly on evolutionary kinship (cladistics) also may often seem to violate common sense. Thus a phylogenetic tree showing the evolutionary history that gave rise to the salmon (a fish), the lungfish, and the cow requires — according to cladistics — that the lungfish and cow be placed in a clade separate from the salmon. Even though the lungfish is a fish, the cow has shared a common ancestor with it more recently than its common ancestor with the salmon. Although it is traditional to classify the lungfish and the salmon together in the class Pisces (fishes), and to assign the cow to the class Mammalia, this violates the rule of cladistics (so Pisces is said to be a paraphyletic group). The lungfish and the cow with their apomorphic traits of
- internal nostrils and
- epiglottis
are descended from a common ancestor (red arrow) that is also the ancestor of all land-living vertebrates (including ourselves!).
Even Darwin recognized that kinship alone was not always enough for a sound taxonomy so he added a second criterion — degree of similarity — to be used in assigning species to a taxonomic category.
- Deducing the evolutionary history of animals is particularly difficult because all the 24 or more phyla of animals appeared within a short time before and during the Cambrian and have since evolved along separate lines. This means that all the branches on the phylogenetic tree are long and bunched so closely at their base that it is difficult to determine their relationships.
- Computer power. More data would help, but as more data become available, the ability of computer programs to sort out the most likely tree becomes overwhelmed.
- Changing rate of evolution. There is considerable evidence that mutation rates are not steady from branch to branch in phylogenetic trees. Thus a branch based on molecules that have evolved rapidly would seem longer than otherwise.
- Back mutations. These mask the changes that preceded them and make branches look shorter than they should be.
- Gene transfer between species. The recent availability of complete gene sequences for many bacteria have revealed genes that appear to have passed from one group to another rather than having been descended from a common ancestor. Most of these "horizontal" gene transfers are between two different species of bacteria, but the gene sequence of Mycobacterium tuberculosis reveals 8 genes that it appears to have picked up from its human host! So many horizontal gene transfers have occurred that some bacterial taxonomists despair that a proper phylogenetic tree can ever be deduced for them.
- Convergent evolution. Evolution in which two species from different genealogies come to resemble each other is called convergent evolution and structures that resemble each other superficially (and may serve the same function) are called analogous.
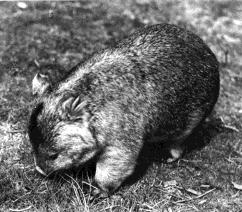
There are many examples of marsupial mammals in Australia which bear a striking resemblance to placental mammals of Europe and North America. The North American woodchuck or groundhog and the Australian wombat (photo courtesy of the Australian News and Information Bureau), for examples, look superficially to be close relatives. But their similarities are analogous, not homologous, and have arisen as a result of similar selection pressures in similar ecological niches. The wombat has no placenta, cares for its young in a pouch as other marsupials do, and should be classified with them. In fact we are more closely related to the North American woodchuck than the wombat is!
In the language of cladistics, the wombat is placed in a clade with all marsupials because they share the marsupial pouch (an apomorphic trait) but are nonetheless mammals because they, too, have hair (a plesiomorphic trait).
Convergent evolution also occurs at the level of molecules.
Examples:
- Cows and langur monkeys both synthesize a lysozyme that share the same activity, but comparison of their amino acid sequences indicates that each has evolved from a different ancestral molecule.
- Cows and the bacterium Yersinia both synthesize a tyrosine phosphatase with similar three-dimensional structures around their active site and similar activity. However, each has evolved from a totally different ancestral molecule.
- The bacterium Bacillus subtilis synthesizes a serine protease that acts just like those synthesized by mammals but not only has an entirely different primary structure but its three-dimensional structure (tertiary) structure is different as well.
- Representatives of four different orders of insects, orders that last shared a common ancestor 300 million years ago, have independently evolved an identical point mutation in their Na+/K+ ATPase which protects it from inactivation by the cardiac glycosides in the plants on which they feed. Link to an illustrated discussion of how this mutation can lead to aposematic coloration and mimicry.
16 December 2013